Bibliography Background About KRIS
Modeling Shallow Landslides
The landscape of northwestern California has been formed by rapid, recent uplift and is riddled with major earthquake faults (Judsen and Ritter 1964, California Department of Water Resources 1982). Continental plate collisions off the coast cause buckling of the earth’s crust, forming major faults on land that many northwestern California rivers follow (Carver and Burke 1987). A significant portion of the landscape is over-steepened in this process and has a high risk of slope failure. The highest risk of slope failure is at the headwaters of streams (often small, "class 3", watercourses that are not visible on standard 7.5" USGS topographic maps), in steep terrain. Most of these lands were not logged in prior eras because they were inaccessible. In many instances, over-steepened slopes are kept from sliding by the roots of trees (Ziemer, 1981).
After logging, slope failure rates greatly increase (Sidle, 1985) and the risk of slope failure may extend for 8-30 years as tree roots rot out (Frissell, 1992). Dietrich and Montgomery (1994) noted that: "Although shallow landsliding and associated debris flows are an integral part of natural landscape processes, forest management practices can greatly increase the frequency of their occurrence, which can lead to degradation of stream habitat and loss of habitat features through high sediment loading."
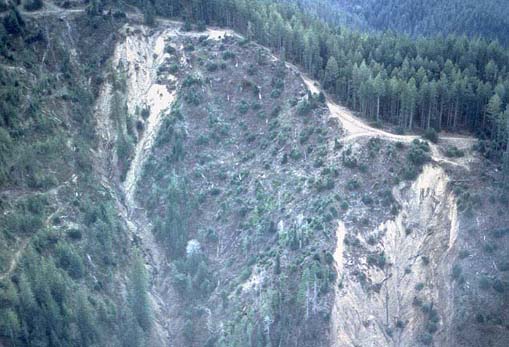
Montgomery and Dietrich (1994) also point out that: "The sudden failure and high speed of shallow landslides that mobilize as debris flows make them particularly destructive of downstream resources, property and lives." The photo below shows an example of a debris slide near the town of Stafford in California. All images in this page can be viewed in greater detail by clicking on the small image within the blue border.
 Landslides can be detected
and mapped through a combination of field research and the study of aerial photographs.
Geologists use professional judgment and knowledge of local geology and topography
to classify areas into landslide hazard categories. An alternative, relatively
new method, is to use digital land shape information and computer software to
create landslide hazard category maps. Currently these automated maps are limited
to shallow landslides (debris slides) and have to be augmented by inner-gorge
hazard zones mapped from photographs because of the relatively inaccurate information
provided by digital terrain maps about inner-gorge areas . The automated maps
flag areas of high risk. Management activities in these high-risk areas should
be avoided or the safety of proposed disturbances should be reviewed by a geologist.
Landslides can be detected
and mapped through a combination of field research and the study of aerial photographs.
Geologists use professional judgment and knowledge of local geology and topography
to classify areas into landslide hazard categories. An alternative, relatively
new method, is to use digital land shape information and computer software to
create landslide hazard category maps. Currently these automated maps are limited
to shallow landslides (debris slides) and have to be augmented by inner-gorge
hazard zones mapped from photographs because of the relatively inaccurate information
provided by digital terrain maps about inner-gorge areas . The automated maps
flag areas of high risk. Management activities in these high-risk areas should
be avoided or the safety of proposed disturbances should be reviewed by a geologist.
KRIS uses a model developed by Montgomery and Dietrich (1994) to show areas of high risk for shallow landslides and debris sliding. The model runs in ESRI's ArcView/Spatial Analyst program and takes into account both the concentration of water as it flows downhill and the steepness of slopes. The model predicts the locations of highest risk of slope failures.
SHALSTAB works best with detailed elevation data. A standard U.S. Geologic Survey 1:24,000 scale DEM (Digital Elevation Model) file contains elevation information for every 30x30 meter location covered by a7.5' quadrangle. This "grid" of 30x30 meter cells is too coarse for most SHALSTAB applications. For this reason a special set of 10 meter DEMs was produced from U.S. Geologic Survey 1:24,000 scale contour maps.
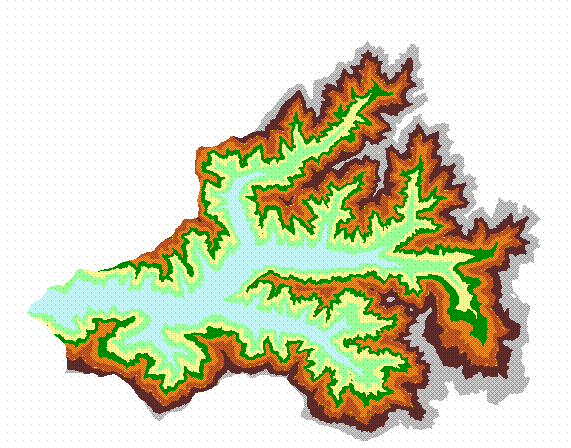
 This
map shows an elevation grid of 1000 by 1400 cells. Each cell contains an
individual elevation value for a 10x10 meter location on the ground.
The various elevations are grouped together by color. This map is used to
compute steepness and wetness.
This
map shows an elevation grid of 1000 by 1400 cells. Each cell contains an
individual elevation value for a 10x10 meter location on the ground.
The various elevations are grouped together by color. This map is used to
compute steepness and wetness.
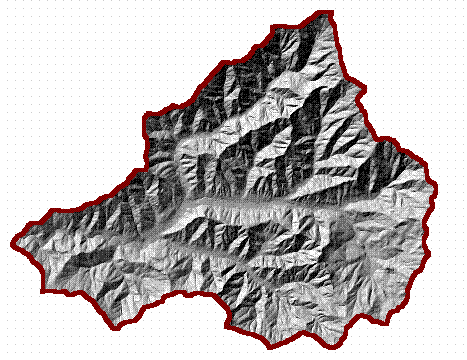
To the right is an artificial 3D landscape reconstructed from the 10 meter DEM.
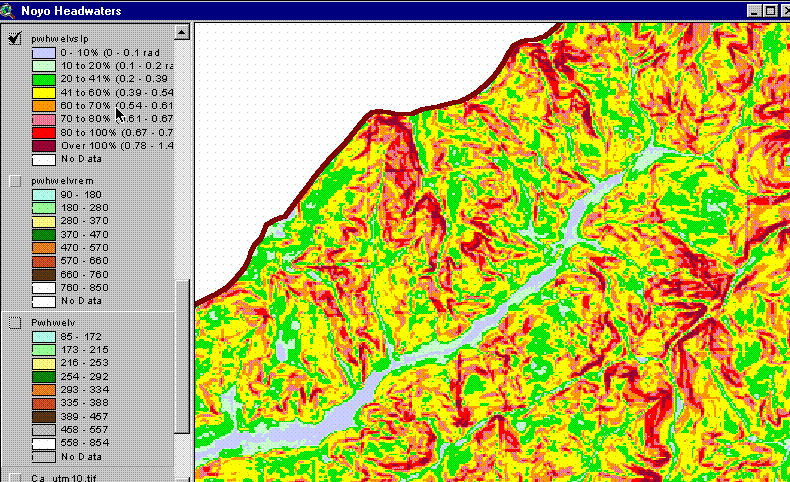 Slope steepness can be analyzed independently. The map at left shows steepness of the landscape color coded so that areas at risk when disturbed are easily recognized. Slopes with greater steepness have a greater landslide risk. For example, concave slopes (hollows) with a steepness greater than 60% were designated "high hazard" in various Oregon test basins in a recent study (Shaw S.C. and Vaugeois L.M. 1999). The "high hazard" rating was also given to flat slopes with a steepness greater than 70%.
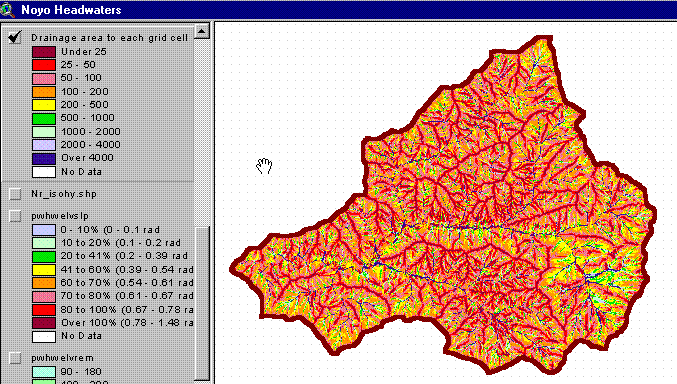 To compute the concentration of water for each location on the ground SHALSTAB computes the drainage area for each cell, i.e. the number of cells that contribute water to a given cell. For example, a cell with a drainage area of 500 cells receives water from an area of 500 times 10x10 meter cells (12.4 acres). The cell in the example "accumulates the flow" of 500 other cells.
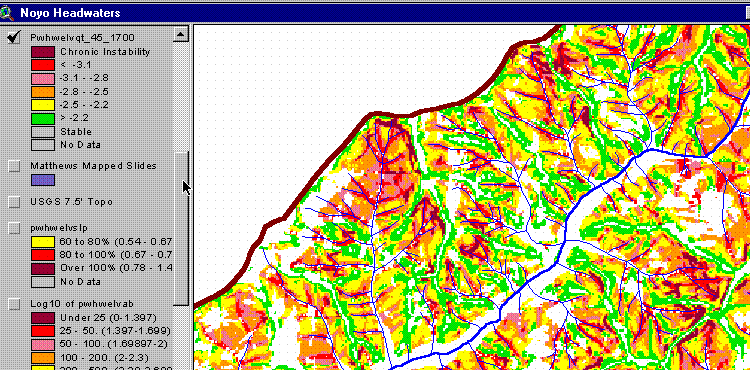 SHALSTAB combines flow accumulation with slope steepness in maps that show areas at high risk of slope failure. The map below shows a landslide hazard map for an area near the headwaters of the Noyo in California. Areas of highest risk have low, negative scores. Dietrich (Dietrich, 1998) requests users of the SHALSTAB model to employ standard soil parameters he developed in his 1998 validation study to facilitate uniform results. The example below is from the Noyo River basin and for this area, he proposes tentatively a "high hazard" classification for scores equal or below -2.8. when produced by SHALSTAB with standard soil parameters and 10 meter digital elevation data.
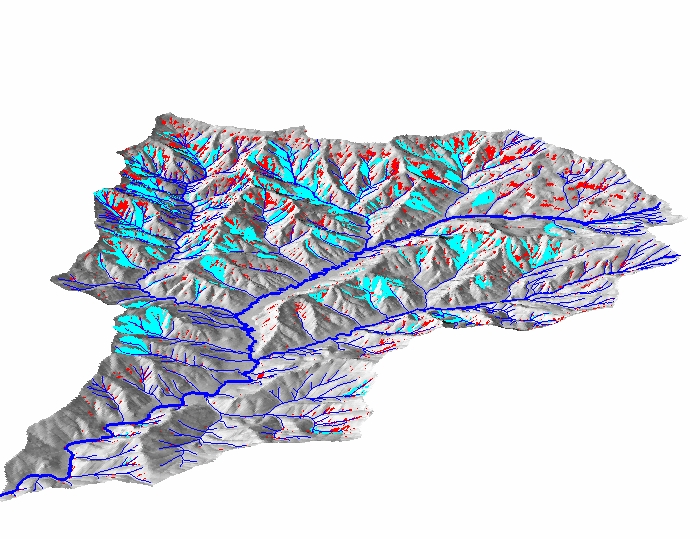
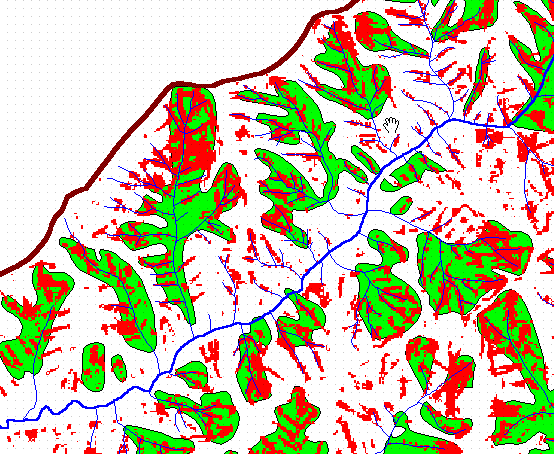 This map, from the KRIS Noyo Map project, shows in red, landslide-prone areas (scores below -2.7) flagged by SHALSTAB, and, in green, the amphitheater/debris slide slope map, developed by the California Department of Conservation, Division of Mines and Geology. CDMG maps are based on aerial photos and field investigations. According to CDMG, debris slide amphitheaters and slopes are geomorphic features in which slopes have been sculpted by numerous debris slide events. The amphitheaters and slopes are characterized by an aggregate of debris slide scars left by the movement of predominantly unconsolidated rock, colluvium, and soil along relatively shallow failure planes.
This image (left) is a simulated 3D landscape of the Noyo headwaters with areas flagged by SHALSTAB in red, and CDMG-mapped debris slide amphitheaters in blue.
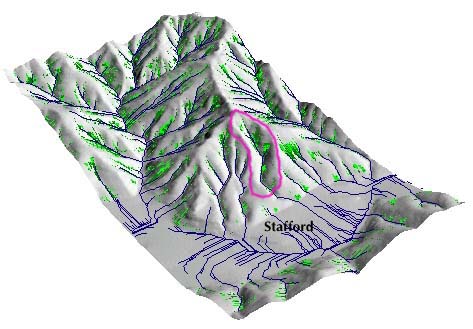 Aerial photographs of the Stafford area after the January 1997 storm show debris slides that occurred on high risk slopes above the town. This artificial 3D landscape shows that SHALSTAB predicted the source areas (marked with purple circle) of the Stafford slide. Areas flagged by SHALSTAB are shown in green.
The SHALSTAB model cannot be used to predict with certainty that landslides will occur after timber harvest in a high risk area; rather, it should be used to judge the risk of harvesting activities on a landscape scale. Factors that influence the occurrence of landslides and are not included in the model as yet: soil thickness, rainfall intensity and duration, sub-surface flow orientation, bed rock fracture flow and tree root strength (Sidle, 1985).
An important, open, topic of discussion is the translation of model output into land-use management decision criteria. The Washington Department of Natural Resources validation study (Shaw, 1999) remarks:
"Our study also motivates the need for continued discussion of appropriate ways to parameterize model predictions of landslide potential in terms of management decision-making criteria. We have identified a number of alternatives for converting model predictions of landslide potential to decision criteria. All of them, however, rely on the current management formulation of what constitutes 'hazard' and 'risk', whereby hillslope processes are treated deterministically (e.g., the analysis of 'hazard' does not necessarily take into account the history of landslide processes predating recent management activities). It may be that GIS-based topographic models more accurately reflect the full spatial and temporal distribution of potential unstable slopes than do landslide databases generated during watershed analyses, because the former are measuring landslide potential based on landform characteristics that largely existed prior to 20th century land management, while the latter are based heavily on aerial-photo interpretation and, hence, provide only a contemporary measure of landslide rates. GIS-based models, therefore, could be useful in helping to redefine the way in which hazard-zonation maps typically are generated."
Note: Geologic information, electronic maps and models within KRIS projects are meant to provide background information only and not as a decision making tool. California requires that licensed geologists be involved directly in decisions related to geologic conditions (see requirement).
References
Burroughs, E. R., and B. R. Thomas, Declining root strength in Douglas-fir after falling as a factor in slope stability, Res. Pap. INT-190, 27pp., Forest Serv., U.S. Dep. of Agric., Ogden, Utah, 1977.
California Department of Water Resources. 1982. Watershed management for unstable and erodible areas in northwestern California. Prepared for U.S. Environmental Protection Agency and the California State Water Resources Control Board. 68 pp.
Carver, G.A., and RM. Burke. 1987. Late Pleistocene and Holocene paleoseismicity of Little Salmon and Mad River thrust fault systems, Northwest California Implications to the seismic potential of the Cascadia Subduction Zone.Geo. Soc. of Amer. Abstracts. Vol. 9(7).
Dietrich, W.E. et al. 1998. A validation study of the shallow slope stability model, SHALSTAB, in forested lands of Northern California. Stillwater Ecosystem, Watershed & Riverine Sciences. Berkeley, CA. 59 pp.
Frissell, C.A. 1992. Cumulative effects of land use on Salmonid habitat on southwest Oregon streams. Ph.D. thesis, Oregon State University, Corvalis, OR.
Judson, S. and D.F. Ritter. 1964. Rates of regional denudation in the United States. Jour. of Geophys. Research. Vol.69( 11):3395-340 1.
Matthews, Graham and Associates. 1999. Sediment Source Analysis and Preliminary Sediment Budget for the Noyo River. Prepared for: Tetra Tech,Inc. under contract 68-C7-0018, work assignment # 0-18. Matthews Assoc., Weaverville, CA.
Montgomery, D.R. and W.E. Dietrich. 1994. A physically based model for the topographic control on shallow landsliding. Water Resources Research, Vol.30, No.4. April 1994. Pages 1153-1171.
Montgomery D.R., K. Sullivan, and H.M. Greenberg, 1998. Regional test of a model for shallow landsliding. Hydrological Processes 12: 943-955
Shaw S.C. and Vaugeois L. M. 1999. Comparison of GIS-based models of shallow landsliding for application to watershed management. TFW report PR10-99-001. Washington Department of Natural Resources. Olympia, WA 110 pp.
Sidle, R. C. 1985. Factors influencing the stability of slopes. U.S.D.A. Forest Service General Technical Report PNW-180 April, 1985.
Ziemer, R.R. 1981. Roots and Stability of Forested Slopes. In proceedings: Symposium on Erosion and Sediment Transport in Pacific Rim Steeplands. Christchurch, New Zealand. January 1991. Pages 343-361.