| Area | South Fork |
| Topic | Temperature: Min, Max and Average Lower Mainstem South Fork Noyo 1997 |
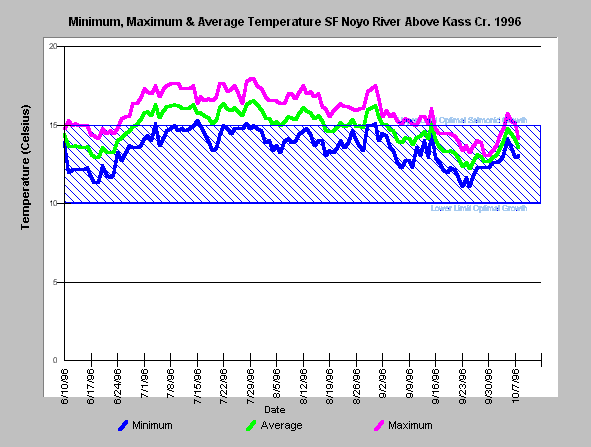
| Caption: The chart above shows the minimum, maximum and average water temperature of the South Fork Noyo River above Kass Creek (site #16) during the summer of 1996. Maximum and average temperatures exceeded the optimal range for salmonid growth throughout summer. See InfoLinks or Temperature Background page to find information on threshold listed. | |
 |
To learn more about this topic click here .
To view the table with the chart's data, click Chart Table web page.
To download the table with the chart's data, click sfn1696mma.dbf (size 8,511 bytes) .
To see meta information about the data table used for this topic click here
| www.krisweb.com |
