| Area | Jacoby Creek |
| Topic | Sediment: Suspended Sed. Load at Lower Jacoby Cr (JTG, JBW) 2003-05 |
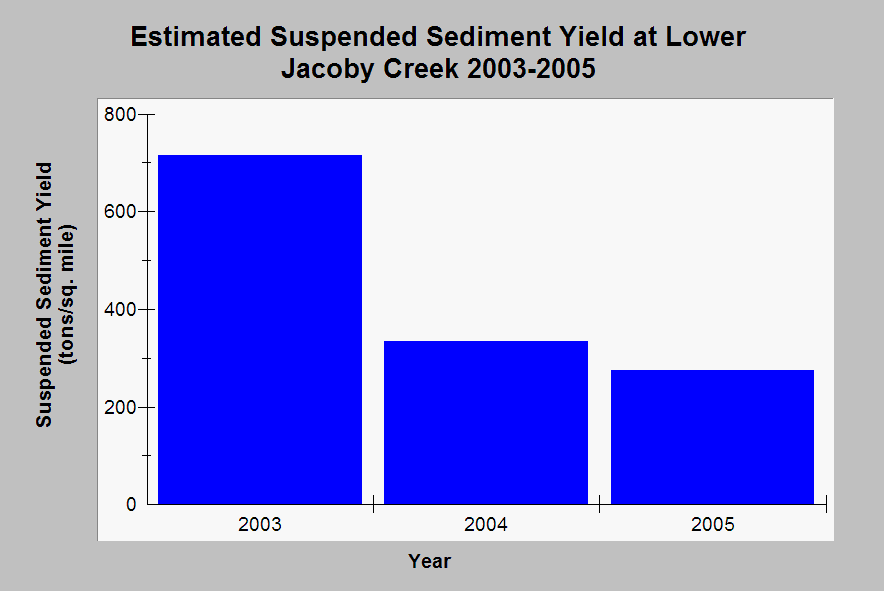
| Caption: This chart shows estimated annual suspended sediment yield for the turbidity threshold sampling station in lower Jacoby Creek (stations JTG and JBW) for hydrologic years 2003-2005. Sediment loads were estimated by combining turbidity, suspended sediment and discharge data. Randy Klein collected and processed the data. See Info Links for more information. | |
 |
To learn more about this topic click Info Links .
To view additional information (data source, aquisition date etc.) about this page, click Metadata .
To view the table with the chart's data, click Chart Table web page.
To download the table with the chart's data, click sed_sedload_klein_jbw_jtg_2003_2005.db (size 18,432 bytes)
To download the table with the chart's data as an Excel spreadsheet, click sed_sedload_klein_jbw_jtg_2003_2005.db.xls (size 4,096 bytes) .
| www.krisweb.com |
